About Freelock
We continue to grow at Freelock and with more team members it means we have more employees engaged with each client. As the volume of our work gets too big to handle in any one person's head, it was time to get some effective data visualization to track our progress against our plan and provide accountability for our time. We needed cool customized reports that show where our time went on specific projects and team members.
The Project
We have great data for each of our projects and each team member, but it was time to add data visualization for more efficient and “at a glance” reporting. We wanted to know how many different projects we work on in a week, and who spent their time on what. What’s great is that since we pulled from existing data we can pull the same report for 5 years ago to see how we have evolved since then. It’s great for comparing year over year as well.
Customization
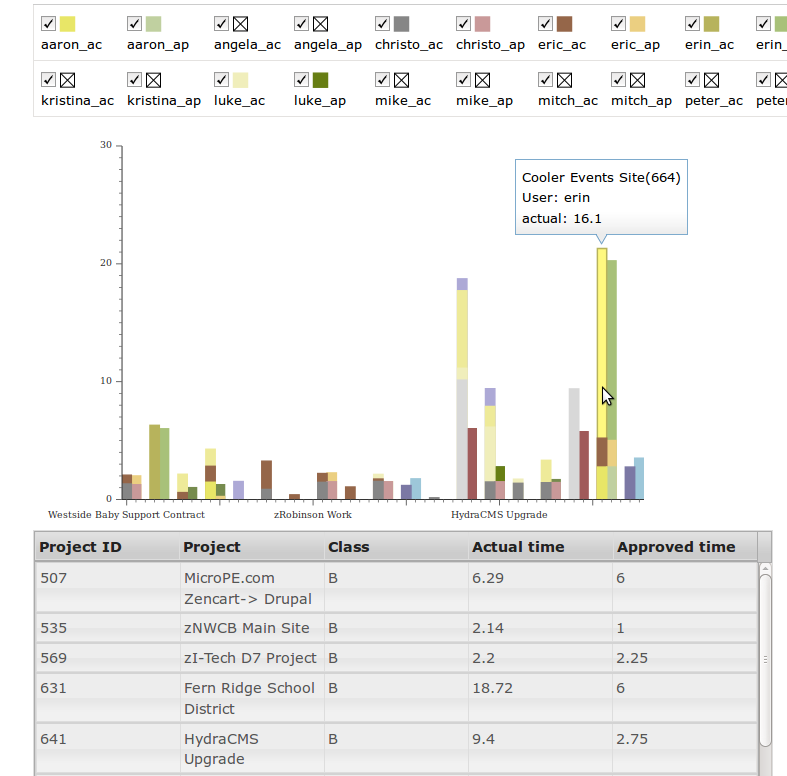
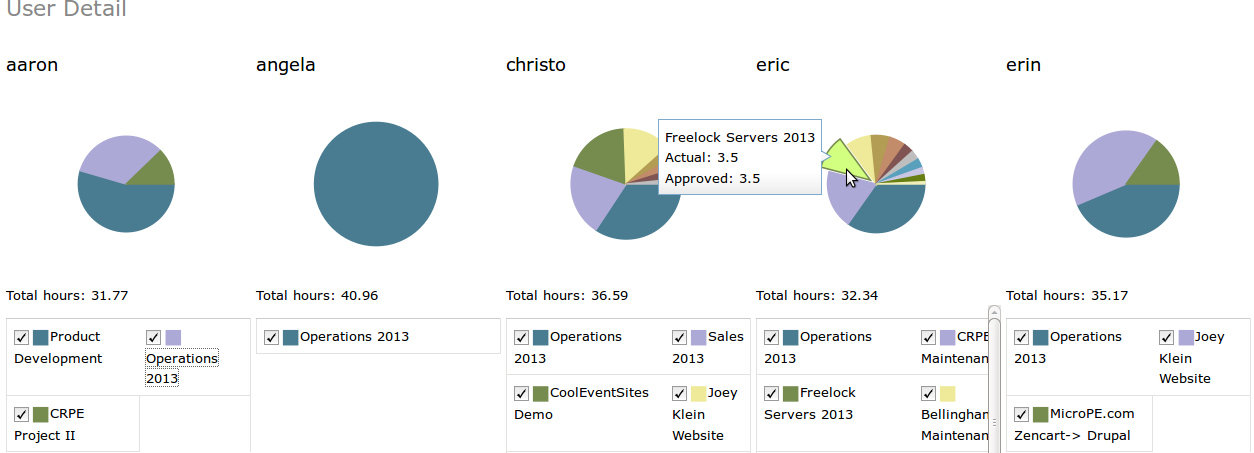
We were able to leverage standard widgets and charts from the Dojo Toolkit for this project. We had all of our data ready to go and needed to define what data we wanted for each of the charts and customize them for our specific needs. We built a custom Dojo widget that would load the data for a particular employee, and a system that loaded one of these widgets for each employee with data in the particular time period. Using Dojo's browser-based store, we have 16 different charts all tied to the same raw data set, and by requesting data for a different time period, all of the charts update themselves.
Timeline
We were able to complete this project in 12 hours.
If a tracking system and data visualization of your business data is what you need for your organization, let’s talk!