
A real-world post-mortem on 15 performance issues we fixed in 4 days — and what every WordPress site owner should know before going live.
Launch day is supposed to be a celebration. You've spent weeks or months preparing, migrating content, testing integrations, coordinating teams. Then the site goes live — and within minutes, pages are timing out. The admin panel crawls. The server is maxed out and you don't know why.
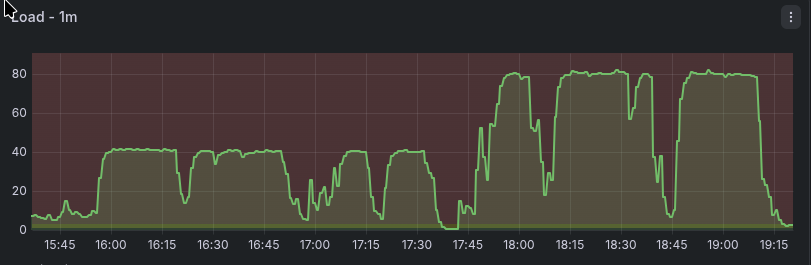
That's exactly what happened with a recent client of ours: a large professional membership organization that launched a new WordPress site last week. We manage their server, so we had full visibility into what was happening from the moment load started climbing. By the end of the first day, we were deep into an emergency performance investigation. Four days and 20+ hours of work later, the site was stable — and we'd resolved more than a dozen distinct issues at the server, database, caching, and application layers.
This post is a technical post-mortem. If you're running or inheriting a large WordPress site — especially one migrating from another platform, with a significant user base, heavy plugins, and custom theme work — many of these patterns will look familiar. We'll also talk at the end about how we used AI coding agents to accelerate the diagnosis — and why that only works if you already know what you're looking for.
Why WordPress Performance Crises Happen at Launch
Performance problems that don't appear in staging tend to appear in production for a predictable set of reasons:
- Staging environments have less data — queries that look fast against 1,000 rows are slow against 100,000.
- Staging has no real traffic — concurrency problems only show up under load.
- Production has active bots and attackers from the moment the site becomes active.
- Development sites often have generous shared resources that obscure RAM and CPU limits.
- If you're migrating from another platform, the new application may have a very different resource profile than what the server was tuned for.
That last point turned out to be central in this case. The server had previously run a Drupal site. We manage our server fleet using NixOS with a shared repository of declarative configuration modules — host-specific settings layered on top of shared infrastructure modules that enforce consistency across servers. The PHP-FPM configuration in place had been shaped by Drupal's memory profile, and while we had WordPress-specific configuration work in progress, it wasn't fully applied before launch. Once WordPress went live under real traffic, the mismatch became immediately apparent.
1. The Server Tuning Problem: Balancing RAM Across PHP and the Database
This was the most foundational issue, and it required several rounds of adjustment to resolve properly.
PHP-FPM manages a pool of worker processes that handle incoming requests. Each worker has a maximum RAM allocation. For a Drupal site with a modest footprint, workers might run comfortably at 128–256MB each. WordPress — particularly with a large plugin set including FacetWP, Wordfence, and a custom theme with complex queries — was regularly pushing individual processes to 400–500MB or more - and some pages required over 3GB to generate. Workers that hit their RAM limit get killed and restarted, which under load means constant churn and dropped requests.
The complication: the database was on the same server. MariaDB needs its own RAM allocation — specifically, innodb_buffer_pool_size, which controls how much data the database engine caches in memory before falling back to disk reads. So the tuning problem wasn't simply "PHP workers vs. RAM" — it was a three-way balance:
RAM per PHP worker × number of workers + database buffer pool + OS overhead = total available RAM
Increase RAM per worker to accommodate WordPress, and the worker count must come down. Allocate more to the database buffer pool, and there's less for PHP. We went through several rounds: increase worker RAM ceiling, reduce worker count, tune the buffer pool, deploy under load, observe, repeat. Midway through the engagement, we also resized the server itself — from 2 CPU / 8GB RAM to 4 CPU / 16GB RAM — which gave us enough headroom to reach a stable configuration without forcing harsh tradeoffs between the two.
Once we had the right settings dialed in, they were codified in our NixOS configuration for the server. These become immediately available for the next server we provision for a similar scale WordPress site, not as something to remember to configure, but as something the system simply applies.
2. The 404 Flood: Why Blocking Before WordPress Matters
While diagnosing the load, we analyzed the access logs and found something striking: at any given moment, the server was receiving 4–7 PHP requests per second. The vast majority of them were returning 404 Not Found.
Some of this was bot traffic systematically probing for common WordPress attack paths. Some was likely legitimate traffic hitting old Drupal URLs that no longer existed after the migration. Either way, every one of those requests was landing in WordPress's routing layer, triggering a full PHP bootstrap, a database lookup, and then a 404 response.
WordPress is noticeably more expensive at producing 404s than Drupal. The framework does significantly more work before concluding a page doesn't exist — loading plugins, running hooks, querying the database. Under the load we were seeing, those 404s were consuming a meaningful share of available PHP workers around the clock.
The strategic response was to push request handling as far upstream as possible:
- Block known attack paths (
/xmlrpc.php, common vulnerability scanners) at Nginx with a hardreturn 444, before PHP is ever invoked. - Configure Nginx FastCGI caching for anonymous traffic, so valid cached URLs are served without hitting PHP at all.
- Rate-limit aggressive bots and crawlers by user agent at Nginx.
- Deploy fail2ban to ban repeat offenders at the firewall level — where blocked requests cost essentially nothing.
The principle is consistent: a request stopped at the firewall costs almost nothing. A request stopped at Nginx costs very little. A request that reaches PHP-FPM costs a worker. A request that reaches WordPress and queries the database costs the most. Every layer you push handling upstream multiplies your effective capacity.
On configuration gaps in complex systems
We've written before about rate-limiting aggressive bots in Nginx — we've been dealing with increasing waves of bot attacks, startingt with a Bytespider crawl in 2023 that hammered a search endpoint. We've developed solid patterns for handling it, and with each new attack, we update our patterns to keep sites responsive. Those patterns existed in our configuration repository. What we found during this incident was that they hadn't been applied to the new WordPress vhost. Not because we lacked a process, but because a platform migration involves an enormous number of moving parts, and this one slipped through.
This is precisely where declarative infrastructure management earns its keep. The answer to configuration gaps isn't just adding more items to a checklist — it's encoding what you know into the system itself, so it's applied automatically to any new deployment. The bot rate-limiting rules are now part of our NixOS WordPress module. The WordPress-specific PHP-FPM tuning is there too. Every time we hit a new issue, our shared configuration gets smarter — and the gap that existed once can't exist again.
Complex systems have a lot of moving parts. Mistakes happen. The goal is to make each mistake a permanent improvement rather than a recurring one.
3. Database Performance
Once the server was stabilized enough to profile properly, several database-level problems surfaced.
Buffer Pool Tuning
As part of the RAM balancing act above, we tuned innodb_buffer_pool_size appropriately for the server's available memory. The default of 128MB is designed for small deployments; on a production server with significant data, it means the database is reading from disk far more than necessary. Getting this right was part of the same iterative process as PHP worker configuration — they're coupled, because they compete for the same pool of RAM.
Missing Indexes
Two tables were doing full scans on every request:
- A user registration table with 68,000 rows had no index on the column being queried on every page load. Adding the index dropped query cost to negligible.
- The FacetWP search index was similarly unindexed, causing 3+ second queries on every search interaction. We added the index, enabled result caching, and rescheduled the automatic full index rebuild from "during business hours" to 1 AM.
Missing indexes are invisible without query profiling — the query works, it's just slow. The slow query log is your first tool.
Leftover Import Data
Previous content imports via WP All Import Pro had left behind nearly 1 million rows of temporary session data, generating slow queries on every request. We cleaned it up and added additional indexes. If you've done bulk content imports, check your database for leftover tables — they accumulate silently.
4. Caching with Redis
WordPress reads its full configuration dataset — the wp_options table — on every single request. On this site, that payload had grown to approximately 70KB, read from the database every time a page loaded. We deployed Redis as a persistent object cache, so that data is loaded once into memory and served from there on all subsequent requests.
We also configured Redis for FacetWP search result caching, so repeated searches against the same filters don't regenerate results from scratch. Redis is now a standard component of our WordPress server configuration.
5. WP-Cron and Background Tasks
WordPress's built-in task scheduler (WP-Cron) was running multiple jobs concurrently, some of which ran for hours and consumed gigabytes of RAM. One was observed running for over 7 hours.
The fixes: use flock to ensure only one cron job runs at a time, set a 5-minute timeout so runaway jobs are killed automatically, cap RAM per job at 500MB, and replace WordPress's pseudo-cron (triggered on page loads) with a proper system cron. With many active plugins, the cron queue accumulates jobs with no visibility into what's running or how long it's taking. PHP-FPM slow logs will surface any process exceeding a threshold you set, with a stack trace identifying what was running.
Action Scheduler
Several plugins use WooCommerce's Action Scheduler for background processing. During heavy admin activity — bulk imports, video syncing, image optimization — Action Scheduler flooded all PHP workers with concurrent loopback HTTP requests, making the server unresponsive. A simple mu-plugin capping concurrent batch runners at 2 resolved this.
6. Problematic Plugins
Jet Reviews: Writing to the Database on Every Page Load
The Jet Reviews plugin (star ratings) was executing a database write on every page load — even on pages with no reviews. At scale this adds up fast. The plugin was disabled. Notably, it was re-enabled by site administrators multiple times before staying off. If you disable a plugin for performance reasons, make sure everyone with admin access knows why.
Wordfence's Reporting Flood
Wordfence was contributing to the problem rather than just protecting against it. During brute-force attack traffic, it spawned 20+ PHP workers for 2–4 minutes each to report attack data to Wordfence's servers. By blocking the attack paths at Nginx before they reached WordPress, Wordfence had nothing to report — and the worker flood stopped. The best way to control what your security plugin does under attack is to handle as much of the attack before it ever reaches the plugin.
7. Theme Query Problems
ORDER BY RAND()
The related content carousel used ORDER BY RAND() to randomize results. This forces MySQL to scan and sort the entire result set on every execution — one of the most reliably slow patterns in WordPress development. Under load, workers were hanging for 10–35 seconds waiting for this query.
The fix: cache a pool of 50 matching post IDs per article for 6 hours, then shuffle in PHP. The database does the heavy work once; the randomization is cheap in application code.
Unnecessary Double JOIN
The "Editors Pick" query used a double JOIN that caused MySQL to examine 228,000 rows and take over 2 seconds per execution. We removed the redundant EXISTS clause and added a 12-hour transient cache. Subsequent requests cost essentially nothing. Both queries were invisible during testing and only became apparent under concurrent load — which is why slow query logging and load testing matter before launch.
The Full Picture
What's striking about this list isn't any single item — it's how many independent problems compounded simultaneously. A server tuned for a different application. A database with missing indexes. A plugin writing on every load. A theme query doing a full table scan. Background tasks running for hours. Attack traffic triggering its own secondary floods. All of these together created a situation the server couldn't handle.
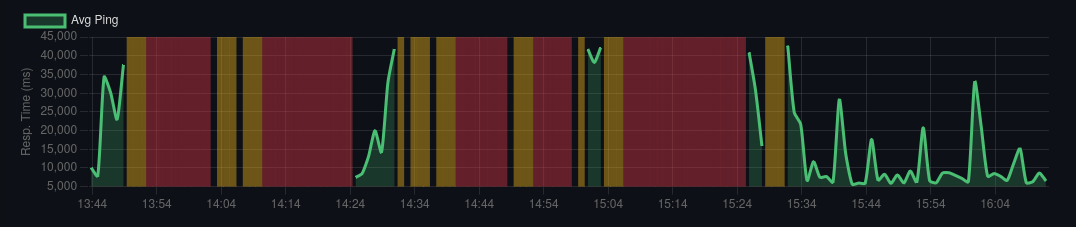
The sequence of fixes mattered too. The very first thing we deployed was Nginx FastCGI caching for anonymous traffic — within minutes it had an immediate stabilizing effect, keeping the site mostly functional for casual visitors while we dug into the deeper problems. Fail2ban was the last piece, deployed at the end of the engagement. Once it was in place and banning attacking IPs at the firewall level, the server finally came down from sustained high load and stayed there. Everything in between was necessary, but those two bookended the arc.
Performance problems on WordPress sites are rarely one thing. They're a convergence of infrastructure defaults never tuned for production, application code that works at small scale and breaks under real data, and external pressures that staging doesn't replicate.
The fix is systematic: instrument everything, find the bottlenecks, resolve them in order of impact — and encode each fix into your infrastructure so it isn't something you have to remember next time.
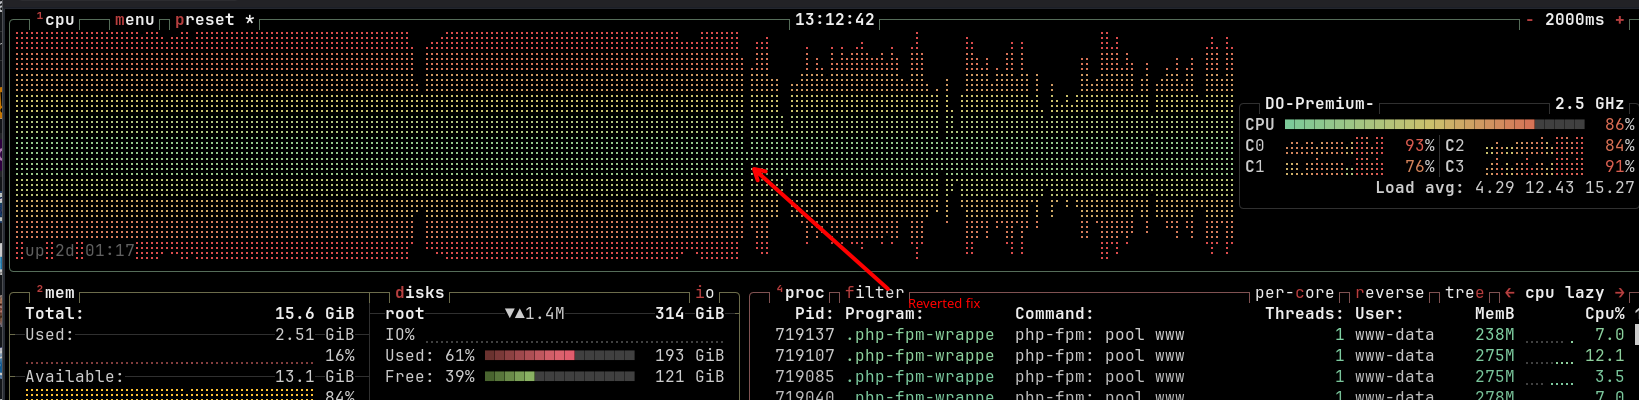
And even after all that work, the site remains sensitive. While writing up this post, we pushed an update to the ORDER BY RAND() query fix — a refinement to the approach — and server load immediately climbed and stayed elevated. When it hadn't come down after 30 minutes, we reverted. Any one of these issues, in isolation, can tip a site that's otherwise balanced back into unresponsiveness. That's not a reason to despair; it's a reason to keep monitoring, keep improving, and understand that performance on a complex WordPress site is an ongoing practice, not a one-time fix.
What About Cloudflare? What About a Separate Database Server?
Two alternatives came up in conversations during and after this incident, and both are worth addressing directly.
Cloudflare
Cloudflare is excellent at what it does, and its bot management and DDoS mitigation tools are genuinely good. It likely would have helped absorb some of the brute-force attack traffic before it reached our server. But it wouldn't have materially changed the outcome for most of the problems we were dealing with.
Cloudflare caches the same class of requests that Nginx FastCGI caching handles — anonymous page requests. Once FastCGI cache is in place, Cloudflare's caching benefit is largely redundant for that traffic. Meanwhile, Nginx was already serving static assets — images, JS, CSS — directly, with no PHP involvement, so that traffic was rarely the bottleneck. The requests that were actually killing the server — authenticated sessions, background tasks, expensive theme queries, plugin floods — aren't cacheable by Cloudflare. They would have passed straight through to the same overloaded PHP workers.
There's also a philosophical dimension worth naming: Cloudflare sits in front of a significant fraction of the internet. Routing your traffic through them solves some problems while creating a single point of failure for your site that you don't control. We prefer to handle what we can at the server level, using tools we own and operate — Nginx rate limiting, fail2ban, FastCGI cache — because the protections are just as effective for the threats we actually face, and we're not dependent on a third party's infrastructure or policy decisions. Cloudflare is a valid choice; it's just not our default, and in this case it wouldn't have been the complete solution.
A separate database server
Splitting the database onto its own server would eliminate the RAM contention between PHP-FPM and MariaDB, which is genuinely one of the harder tuning problems in this engagement. But it comes at real cost: higher hosting spend, network latency between application and database on every query, and additional infrastructure to manage. For a site dealing with missing indexes, a plugin writing on every page load, and expensive theme queries, the bottleneck wasn't the server topology — it was the application. Fixing the application problems on a single server got us to stability. A separate database server would give us more headroom during the tuning process, but the underlying issues would have remained regardless. And even now, the server is still getting maxed out at times -- if we cannot resolve enough performance issues to keep everything on one host, splitting the database out to a dedicated host is the next step.
How We Worked: AI Agents as a Force Multiplier
One thing worth noting about this work: we relied heavily on AI coding agents — specifically Claude Code and opencode — throughout the diagnosis and remediation. In four days, one engineer worked through more than a dozen distinct problem domains simultaneously. AI assistance was a significant part of how that was possible.
But it's worth being precise about what that means in practice, because "AI helped" covers a lot of ground.
The agents were particularly useful for tasks that are time-consuming but well-defined: parsing long slow query logs and MySQL processlist output to surface the worst offenders quickly; analyzing Nginx access logs to identify attack patterns worth blocking; generating candidate Nginx rate-limiting rules for specific user agents or request patterns; and suggesting fixes in parts of the WordPress ecosystem where my own depth was thinner — the mu-plugins approach for capping Action Scheduler concurrency, for instance, was something I hadn't used before. The agent knew it existed; I recognized it was a good solution once it was on the table.
Our infrastructure repositories also turned out to be well-suited to agent collaboration. Our NixOS configuration repo — with its declarative modules for server configuration, Docker image builds, and secrets management via Vault — is significantly more intelligible to an AI agent than an equivalent imperative setup in shell scripts or Salt states would be. When I needed to understand what was configured, or draft a new module based on what we'd learned, the agent could read and reason about the existing configuration accurately. Declarative infrastructure pays dividends beyond consistency and reproducibility — it's also easier for both humans and agents to work with.
What the agents couldn't do was substitute for knowing what questions to ask. When the slow query log surfaced a suspicious query, I had to recognize it as meaningful. When a candidate fix looked plausible, I had to evaluate whether it was actually right for this situation. When the agent suggested blocking a particular pattern, I had to know whether that was safe, complete, and not going to break something else. The agents accelerated the work by an order of magnitude in some places. The expertise determined whether that acceleration was going in the right direction.
"AI amplifies expertise"
- Dries Buytaert, from the DrupalCon 2026 keynote
A novice with the same tools would have gotten a lot of confident-sounding wrong answers. The combination of deep experience and capable agents is genuinely more powerful than either alone.
Quick Checklist Before Your Next WordPress Launch
- Profile PHP-FPM memory usage under load and set worker RAM limits accordingly — don't inherit settings from a different application
- If PHP and the database share a server, balance worker count and RAM against the database buffer pool explicitly
- Set
innodb_buffer_pool_sizeto a meaningful share of available RAM - Run
EXPLAINon your most-used queries and verify indexes on queried columns - Deploy a persistent object cache (Redis or Memcached)
- Enable Nginx FastCGI caching for anonymous traffic
- Block
/xmlrpc.phpand rate-limit/wp-login.phpat Nginx — before requests reach PHP - Rate-limit known aggressive bot user agents at Nginx
- Audit all active plugins for unnecessary database writes or heavy queries
- Find and remove
ORDER BY RAND()in theme and plugin code - Clean up leftover bulk import data
- Add PHP-FPM slow logging
- Audit your Nginx vhost configuration against your hardening standards — don't assume configs from other sites were carried over
Freelock is a boutique firm that specializes in performance tuning, security hardening, and long-term support for complex WordPress and Drupal applications. We manage our server fleet using NixOS with declarative configuration, so fixes get encoded into infrastructure — not just documented. If your site is struggling — or you want to avoid a launch-day crisis — get in touch.


Add new comment