I have a lot of respect for graphic designers and people who can come up with clear, concise information in a graphical way. Which is why I'm a huge fan of GraphViz, a crazily effective layout engine for drawing flow charts, graphs, and the like -- you basically throw pairs of labels at it and it draws lines (called "edges" in mathematical graph-speak) between them, doing its best to automatically lay out everything so there's minimal line-crossing.

For the past couple months, we've been building out an extensive data reporting tool for I-TECH, the International Training and Education Center for Health. They have been formalizing how their various country programs provide reports to funding sources about how grant money has actually been spent.
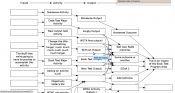
Each program area has a variety of objectives, and each objective has a number of activities with associated inputs, outputs, indicators of success, and more. This gets complicated quickly, even for those who work in it every day.
To help their personnel find the appropriate boxes to fill in, we created a dynamic "logic model" of their data by creating a plugin for Drupal that allows you to use the standard "Views" module to create a clickable map of their data.
The result is pretty slick! The best part is that every time underlying data is updated, the graph gets automatically updated. And this plugin can be applied to all kinds of different views -- it's not hard-coded to the objects in this particular system.
You can download the module in progress here.


Add new comment